Milestone 1 Tuesday, Nov 16th by 11:59 PM
Milestone 2 Thursday, Dec 2nd by 11:59 PM
Getting Started
Getting Started
Download CS201_Assign04_Gradle.zip. Extract the zip file and import it into Eclipse
File→Import…→Gradle→Existing Gradle Project
You should see a project called CS201_Assign04_Gradle in the Package Explorer window.
Milestone 1
There are unit tests for Milestone 1 of this assignment. Test the class implementations by running the unit tests by right-clicking on the file ComplexTest.java and MandelbrotTaskTest.java in the src/test/java/ directory, and then choosing
Run ‘ComplexTest’
Or subsequently by selecting ComplexTest, etc. from the dropdown list in the top right corner of the IDE and clicking the green arrow.
You can also run the program to generate the output file by right-clicking on the file Mandelbrot.java in the src/main/java/ directory, and then choosing
Run ‘Mandelbrot.main()’
Or subsequently by selecting Mandelbrot from the dropdown list in the top right corner of the IDE and clicking the green arrow.
Milestone 2
There are unit tests for Milestone 2 of this assignment. Test the class implementation by running the unit tests by right-clicking on the file ColorMappingColorChooserTest.java in the src/test/java/ directory, and then choosing
Run ‘ColorMappingColorChooserTest’
Or subsequently by selecting ColorMappingColorChooserTest from the dropdown list in the top right corner of the IDE and clicking the green arrow.
Your Task
Your task is to implement a renderer for the Mandelbrot Set, using parallel computation to speed up the rendering process.
You can see a demo (which also allows zooming by selecting a region with the mouse): Simple Mandelbrot or ColorChooser Mandelbrot.
The Mandelbrot Set
The Mandelbrot set is a fractal: a mathematical object that is self-similar at all scales. It is defined as follows:
-
Each point on the x/y plane is interpreted as a complex number, where x is the real part and y is the imaginary part.
-
A point (x,y) is considered to be in the set if, for its corresponding complex number C the equation
Zn+1 = (Zn)2 + C
can be iterated any number of times without the magnitude of Z ever becoming greater than 2.0. The initial value of Z (Z0) is (0+0i).
Note that the magnitude of a complex number is the square root of the sum of the squares of its real and imaginary components. See the Wikipedia article linked above for an explanation of how to add and multiply complex numbers.
For example, using the provided default values for the range (-2.0,-1.0) to (2.0,2.0) produces the following generated output file (click to see larger version):

As a second example, (user input in bold):
Please enter coordinates of region to render:
  x1: -1.286667
  y1: -0.413333
  x2: -1.066667
  y2: -0.193333
Output filename: output.png
Choose a color chooser:
   1 - Simple Gradient
   2 - Color Mapping
1
Enter the number of threads to use: 1
Working...
Output file written successfully!
Should generate an output file that looks something like this (click to see larger version):

There are two milestones:
- Milestone 1: Complete the Complex, MandelbrotTask, and Mandelbrot classes (without parallelism)
- Milestone 2: Complete the ColorMappingColorChooser class and add parallelism to the Mandelbrot class
Complex class
Because the core computation is based on complex numbers, having a class to represent complex numbers will make implementing the computation much easier. Your task is to implement the add(), multiply(), and getMagnitude() methods for complex numbers as described in the comments.
MandelbrotTask class
You will need to implement the MandelbrotTask class by
- Complete a constructor to accept the bounds for the region of computation, the indices of the iteration count array points the task is responsible for computing, and a reference for the iteration count array
- Implementing the run() method (inherited from Runnable to loop over the region and compute each point
- Implementing the computeIterCount() method which will take each point in the array from startCol to endCol and startRow to endRow, and determine the number of iterations based on the Mandelbrot equation until the magnitude of the point exceeds 2.0 (or reaches the maximum number of iterations)
- Implementing the getComplex() method to compute the initial complex value from the region bounds and the array row and column.
Here is a suggested skeleton:
public class MandelbrotTask implements Runnable {
    private double x1, y1, x2, y2;
    private int startCol, endCol, startRow, endRow;
    private int[][] iterCounts;

    public MandelbrotTask(double x1, double y1, double x2, double y2,
                          int startCol, int endCol, int startRow, int endRow,
                          int[][] iterCounts) {
        this.x1 = x1;
        this.y1 = y1;
        this.x2 = x2;
        this.y2 = y2;
        this.startCol = startCol;
        this.endCol = endCol;
        this.startRow = startRow;
        this.endRow = endRow;
        this.iterCounts = iterCounts;
    }

    public void run() {
        for (int i = startRow; i < endRow; i++) {
            for (int j = startCol; j < endCol; j++) {
                Complex c = getComplex(i, j);
                int iterCount = computeIterCount(c);
                iterCounts[i][j] = iterCount;
            }
        }
    }

    // TODO: implement getComplex and computeIterCount methods
}
The idea is that a MandelbrotTask object will compute iteration counts for a portion of the image with rows from startRow (inclusive) to endRow (exclusive) and columns from startCol (inclusive) to endCol (exclusive) from the entire region of the complex plane specified by x1, y1, x2, and y2. The iterCounts array is the single global array used to store the iteration counts for the overall image (where the first dimension is rows and the second dimension is columns).
Hint: When determining the complex number for a given row and col, divide the range of the x/y bounds by the number of steps for the array corresponding to that dimension minus 1 (why?) which can be determined using the .length field for the iterCount array (remember it is a 2D array so may have a different number of rows than columns).
Mandelbrot class
The program has commented code to prompt the user for a pair of x,y coordinates specifying corners of a rectangle in the complex plane, the default coordinates are (-2,-2) to (2,2). The program also has commented code to prompt the user to enter the name of a file ending with the “.png” file extension, the default filename is output.png. Next, the program has commented code to prompt the user to select a color palette, the default is the provided SimpleGradientColorChooser. Lastly, the program has commented code to prompt the user for the number of parallel threads to use, the default is 1. The program will render a WIDTH by HEIGHT pixel image which visualizes the specified region of the Mandelbrot set.
Your task is to implement the computeIterations() method, which will be called by main, to create a set of MandelbrotTask objects and assign them to separate threads for execution. Code has been provided to generate the output image once all the threads have completed.
For example, for a single task to compute the entire region (without using threads)
MandelbrotTask task = MandelbrotTask(x1, y1, x2, y2, 0, WIDTH, 0, HEIGHT, iterCounts);
task.run();
For Milestone 2, determine how to divide up the region based on numThreads provided by the user and distribute the computation to multiple tasks running on separate threads.

Apologies to Allie Brosh
ColorMappingColorChooser class
The ColorMappingColorChooser class has been supplied. It implements the ColorChooser interface, which has a single method: getColor(). After you have completed the following tasks, getColor() will return colors based on the frequency of occurrence of each iterCount. Since the iterCount values do not distribute uniformly across all possible values, many of the iterCount values tend to bunch up into tight groups.
The ColorMappingColorChooser class addresses the issue of the non-uniform distribution of the iterCount values by mapping colors to iterCount values based on their frequency of occurrence, rather than strictly on their value. The frequency of occurence of each iterCount value determines the width of the color spectrum that applies to that iterCount. The spectrum width determines the distance between the colors assigned to the distinct iterCount values.
Your task is to finish implementing the three methods that create the following maps
- iterCountMap maps each distinct iterCount value to the number of times it occurs in the iterCounts array. This determines the frequency of occurrence and the relative width of the spectrum band (distance between the adjacent iterCounts).
- iterSpectrumMap maps each distinct iterCount value stored in the iterCountMap field to the relative location in the color spectrum. Each iterCount value should be retrieved from the iterCountMap (sorted in ascending order) are used to store a location for each iterCount value in the iterSpectrumMap field. The widths of the prior spectrum bands are summed together to determine the relative location of each iterCount value in the color spectrum. Each iterCount value is then centered within its spectrum band.
- iterColorMap maps each distinct iterCount value retrieved from the iterSpectrumMap field to its RGB color. The spectrum location stored in the iterSpectrumMap is then used inside the trignometric sine and cosine functions to provide smooth transitions between red, green, and blue.
There are getter methods provided in the class to return references to these three maps and JUnit test cases have been provided for the createIterSpectrumMap() and createIterColorMap() methods.
Using this class (you’ll need to uncomment the selection code in the main method in the Mandelbrot class) should produce something similar to the following output for the default range (click to see larger version):

or the following output for the zoomed in region:

Creating the iterCountMap
The createIterCountMap() method accepts a reference to the iterCounts array and populates the iterCountMap field from the iterCounts array contents. The iterCountMap correlates each distinct iterCount with the number of times it occurs in the iterCounts array.
The method must iterates through the iterCounts array, and it will either encounter a new entry (and initialize the occurrence count for that entry) or update the occurrence count for an existing entry.
Creating the iterSpectrumMap
The createIterSpectrumMap() method uses the iterCountMap field and populates the iterSpectrumMap. The iterSpectrumMap correlates each distinct iterCount value key in the iterSpectrumMap with its location in the color spectrum. createIterColorMap will then store a distinct color for each iterCount into the iterSpectrumMap.
The method must iterate through the keys of the iterCountMap (in ascending order) and accumulate the location of each iterCount from the beginning of the color spectrum. The occurrence count for each iterCountMap key determines the width of the spectrum band that the iterCount occupies. The sum of the prior occurence counts (widths or spectrum bands) determines the location of the leading edge of the next iterCount spectrum band. Each iterCount is then centered in its spectrum band:
centered location = leading edge location + (width / 2) + 1
The above result is then stored as the value in the iterSpectrumMap with its respective iterCount key.
At the end of iteration, the width of the entire spectrum (the sum of all the values in the iterSpectrumMap) is stored in the class field maxLocation.
Creating the iterColorMap
The createIterColorMap() method utilizes the iterSpectrumMap field to populate the iterColorMap from the iterSpectrumMap contents. The iterColorMap correlates each distinct iterCount key in the iterSpectrumMap with its corresponding RGB color value.
The method must iterate through the iterSpectrumMap to get the spectrum location for each distinct iterCount. The spectrum location is then used to determine the red, green, and blue color components for that iterCount. Each iterCount key and its respective color value are then stored in the iterColorMap. The getColor() method then returns the color associated with each iterCount by looking up the color in the iterColorMap.
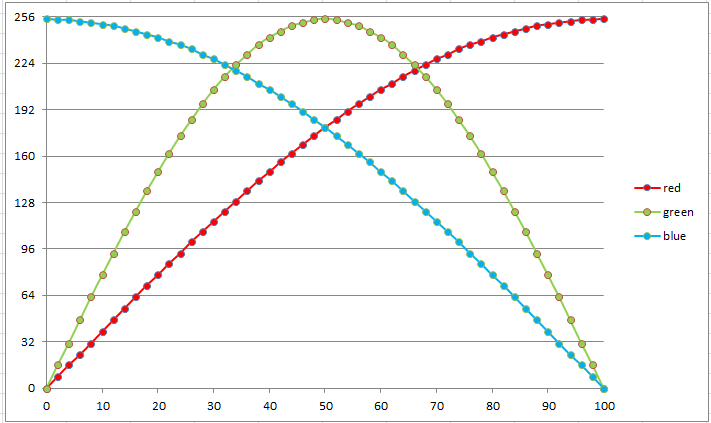
The calculations for the red, green, and blue color components for each iterCount use its relative spectrum location:
relative spectrum location = spectrum location / maxLocation
combined with the sine and cosine trig functions to generate smooth transitions between the composite RGB spectrum colors. The color component calculations are:
red = sin(spectrum location / maxLocation * PI/2) * 255

green = sin(spectrum location / maxLocation * PI) * 255

blue = cos(spectrum location / maxLocation * PI/2) * 255
The color value is then created from:
color = new Color(red, green, blue)
and is assigned to the iterColorMap with its respective iterCount key.
The RGB color generation graph for the above scheme is shown below:
Hints
Rendering the Mandelbrot Set
Rendering the Mandelbrot set is done by assigning a color to sampled points in a region of the x/y plane.
Code is provided in SimpleGradientColorChooser to render points that are in the Mandelbrot set as black. Points that are outside the Mandelbrot set will be rendered using a color that indicates how many times the equation was iterated before the magnitude of Z reached 2.0. In this implementation, the g and b channels will scale logarithmically with the number of iterations.
The renderer will convert each of the iteration array values in the HEIGHT by WIDTH array into a BufferedImage object based on whether or not the point is in the set, and if not, how many iterations were required to show that it is not in the set using the selected colorChooser palette.
Once the image has been rendered into the BufferedImage object, code has been provided to write it to a file as follows:
OutputStream os = new BufferedOutputStream(new FileOutputStream(fileName));
try {
    ImageIO.write(bufferedImage, "PNG", os);
} finally {
    os.close();
}
Parallelism
The computation performed by the program can take a fair amount of CPU time. However, the computation of the number of iterations for each point is independent of the computations for all other points. Therefore, you can speed the program up by using multiple threads to compute the number of iterations in different parts of the overall region.
For example, you might divide the overall region into quadrants or horizontal/vertical strips, and use a separate thread to compute the points in each part. Then if, for example, you use four threads, if you run the program on a computer with 4 CPU cores there could be up to a 4 times speedup.
Suggestion: Create multiple MandelbrotTask objects, and execute each one in a separate thread within the computeIterations() method in the Mandelbrot class.
Grading Criteria
Milestone 1:
- Complex class: 25%
- Render image with single thread (computeIterations()): 15%
- MandelbrotTask class:
- Constructor: 10%
- run(): 5%
- computeIterCount(): 25%
- getComplex(): 20%
Milestone 2:
- Render image with multiple threads (computeIterations()): 25%
- ColorMappingColorChooser class:
- createIterCountMap(): 25%
- createIterSpectrumMap(): 25%
- createIterColorMap(): 25%
Submitting
When you are done, submit the lab to the Marmoset server using the Terminal window in IntelliJ (click Terminal at the bottom left of the IDE).
Milestone 1
Navigate to the directory using
$ cd CS201_Assign04_Gradle
CS201-Fall2021/CS201_Assign04_Gradle
$ make submit_ms1
Enter your Marmoset username and password, if successful you should see
######################################################################
              >>>>>>>> Successful submission! <<<<<<<<<

Make sure that you log into the marmoset server to manually
check that the files you submitted are correct.

Details:

         Semester:   Fall 2021
         Course:     CS 201
         Assignment: assign04_ms1

######################################################################
Milestone 2
Navigate to the directory using
$ cd CS201_Assign04_Gradle
CS201-Fall2021/CS201_Assign04_Gradle
$ make submit_ms2
Enter your Marmoset username and password, if successful you should see
######################################################################
              >>>>>>>> Successful submission! <<<<<<<<<

Make sure that you log into the marmoset server to manually
check that the files you submitted are correct.

Details:

         Semester:   Fall 2021
         Course:     CS 201
         Assignment: assign04_ms2

######################################################################
After you submit
Very important: After you submit the assignment, please log into the Marmoset server and check the files you submitted to make sure that they are correct.
It is your responsibility to make sure that you have submitted your work correctly.
An Agile Approach to Developing the Mandelbrot Renderer Assignment
Just like for the previous assignments, it will be extremely beneficial to tackle this one again with an agile approach. Consider working on one task at a time and frequently testing your code to get one method working before moving on to the next. This assignment, particularly the color mapping color chooser, has methods that depend on each other, so it is critical to develop incrementally.
